


Commercial Industrial Battery Storage Sizing Guide
Commercial & Industrial (C&I) Battery Storage Sizing Guide

Table of Contents
- Core Benefits of Proper C&I Battery Storage Sizing
- Key Technical Metrics for C&I Energy Storage Sizing
- Facility Load Profile & Energy Usage Analysis
- Step-by-Step C&I Battery System Capacity Calculation
- Financial ROI & Operational Efficiency Optimization
- Frequently Asked Questions About C&I Battery Sizing
Core Benefits of Proper C&I Battery Storage Sizing
Sizing a commercial and industrial (C&I) energy storage project requires balancing technical precision with financial return on investment. A properly tailored commercial battery storage sizing strategy ensures facility managers lower peak demand charges, boost microgrid resilience, and maximize solar self-consumption without overspending on excess battery capacity.
Get the sizing right, and the benefits extend well beyond lower demand charges. Facilities can tap into utility demand response programs, earning revenue by curbing grid draw when the local grid is under strain. For operations that can’t afford downtime — manufacturing lines, cold storage warehouses, healthcare campuses — a properly sized system delivers seamless backup power during outages, avoiding lost production, spoiled inventory and missed deadlines. It also keeps capital spending focused: no overpaying for unused battery capacity, stronger IRR on the project, and in many cases, no need for expensive utility service upgrades as facility loads grow.
Key Technical Metrics for C&I Energy Storage Sizing

Defining system parameters begins with two foundational metrics: power rating in kilowatts (kW) and energy capacity in kilowatt-hours (kWh). Establishing the optimal industrial BESS capacity calculation involves evaluating discharge duration against facility load spikes. The power rating dictates how much load the system can deliver instantaneously, while energy capacity dictates how long that power output can be sustained during grid outages or high-tariff peak periods.
The relationship between these two figures is the system’s C-rate, and it dictates what the battery is best suited for. A 1C (1-hour) system can push out full power for 60 minutes, making it a fit for short peak spikes and grid support services. Many commercial and industrial deployments use 2–4 hour systems (0.5C to 0.25C), though the ideal duration varies by local tariff structure, outage patterns and operational priorities. It’s also important to separate nominal capacity — the total energy rating from the manufacturer — from usable capacity, which is the portion you can actually draw on safely under real operating conditions. That difference has a direct effect on real-world savings and project payback.
| Application Scenario | Core Sizing Focus | Power Rating Considerations | Capacity Adjustment Factors |
|---|---|---|---|
| Peak Shaving & Demand Charge Reduction | Flattening peak demand spikes to lower utility bills | Matches the gap between baseline load and target peak import limit | Local tariff interval rules, daily peak window length, seasonal load variation |
| Critical Load Backup Power | Sustaining essential operations during grid outages | Covers the total draw of prioritized critical circuits | Required runtime, site temperature range, DoD limits, auxiliary system loads, end-of-life derate |
| Solar Plus Storage Integration | Maximizing on-site solar self-consumption | Aligns with PV inverter output and maximum charge/discharge rates | Solar generation profile, interconnection export limits, time-of-use tariff windows |
Facility Load Profile & Energy Usage Analysis
Peak Shaving & Demand Charge Reduction Sizing

Accurate sizing relies heavily on high-resolution interval load data, ideally collected at 15-minute intervals over a full 12-month period. Identifying recurring power spikes enables precise demand charge reduction battery sizing, allowing facility operators to flatten energy demand curves. By discharging stored energy during expensive utility peak hours, commercial facilities significantly lower monthly utility expenditures.
In many North American and select Asia-Pacific utility tariffs, demand charges are based on the highest 15-minute average power draw within a billing month — meaning a single unplanned spike can elevate costs for the entire period. Demand interval lengths vary by region and utility provider. To size for peak shaving, you first set a target peak threshold, then size the battery’s power rating to cover the gap between your normal baseline load and that target. The energy capacity is then sized to match how long those peak windows last each day, which differs across rate structures and markets. Good sizing also accounts for multiple peak spikes per day and seasonal shifts in facility load, so savings stay consistent year-round.
Commercial Solar Plus Storage System Sizing

For facilities with existing or planned photovoltaic installations, commercial solar plus storage sizing requires mapping diurnal generation curves against operational load profiles. Storage capacity must absorb excess midday solar generation and dispatch it during evening peak hours or grid disruptions, ensuring compliance with interconnection constraints and localized grid codes.
When sized correctly, a solar-plus-storage setup boosts your self-consumption ratio by capturing midday solar surplus that would otherwise be sent back to the grid at low or zero feed-in rates. Under time-of-use tariffs or net metering rules, that stored solar energy can be deployed in the evening when rates are highest, multiplying the savings on your bill. Sizing also has to stay within grid interconnection limits to avoid export violations and expensive network upgrade charges. For sites running on microgrids or off-grid, the calculation has to factor in stretches of cloudy weather and seasonal changes in sunlight to keep power reliable.
Step-by-Step C&I Battery System Capacity Calculation

To determine the nominal battery capacity required, engineers apply technical adjustments for operating parameters that affect usable energy. A core element is adjusting for depth of discharge BESS degradation, which prevents the battery chemistry from depleting past safe limits. Additionally, system sizing calculations must incorporate inverter conversion factors, auxiliary heating and cooling loads, and expected battery aging over a 10- to 15-year lifecycle.
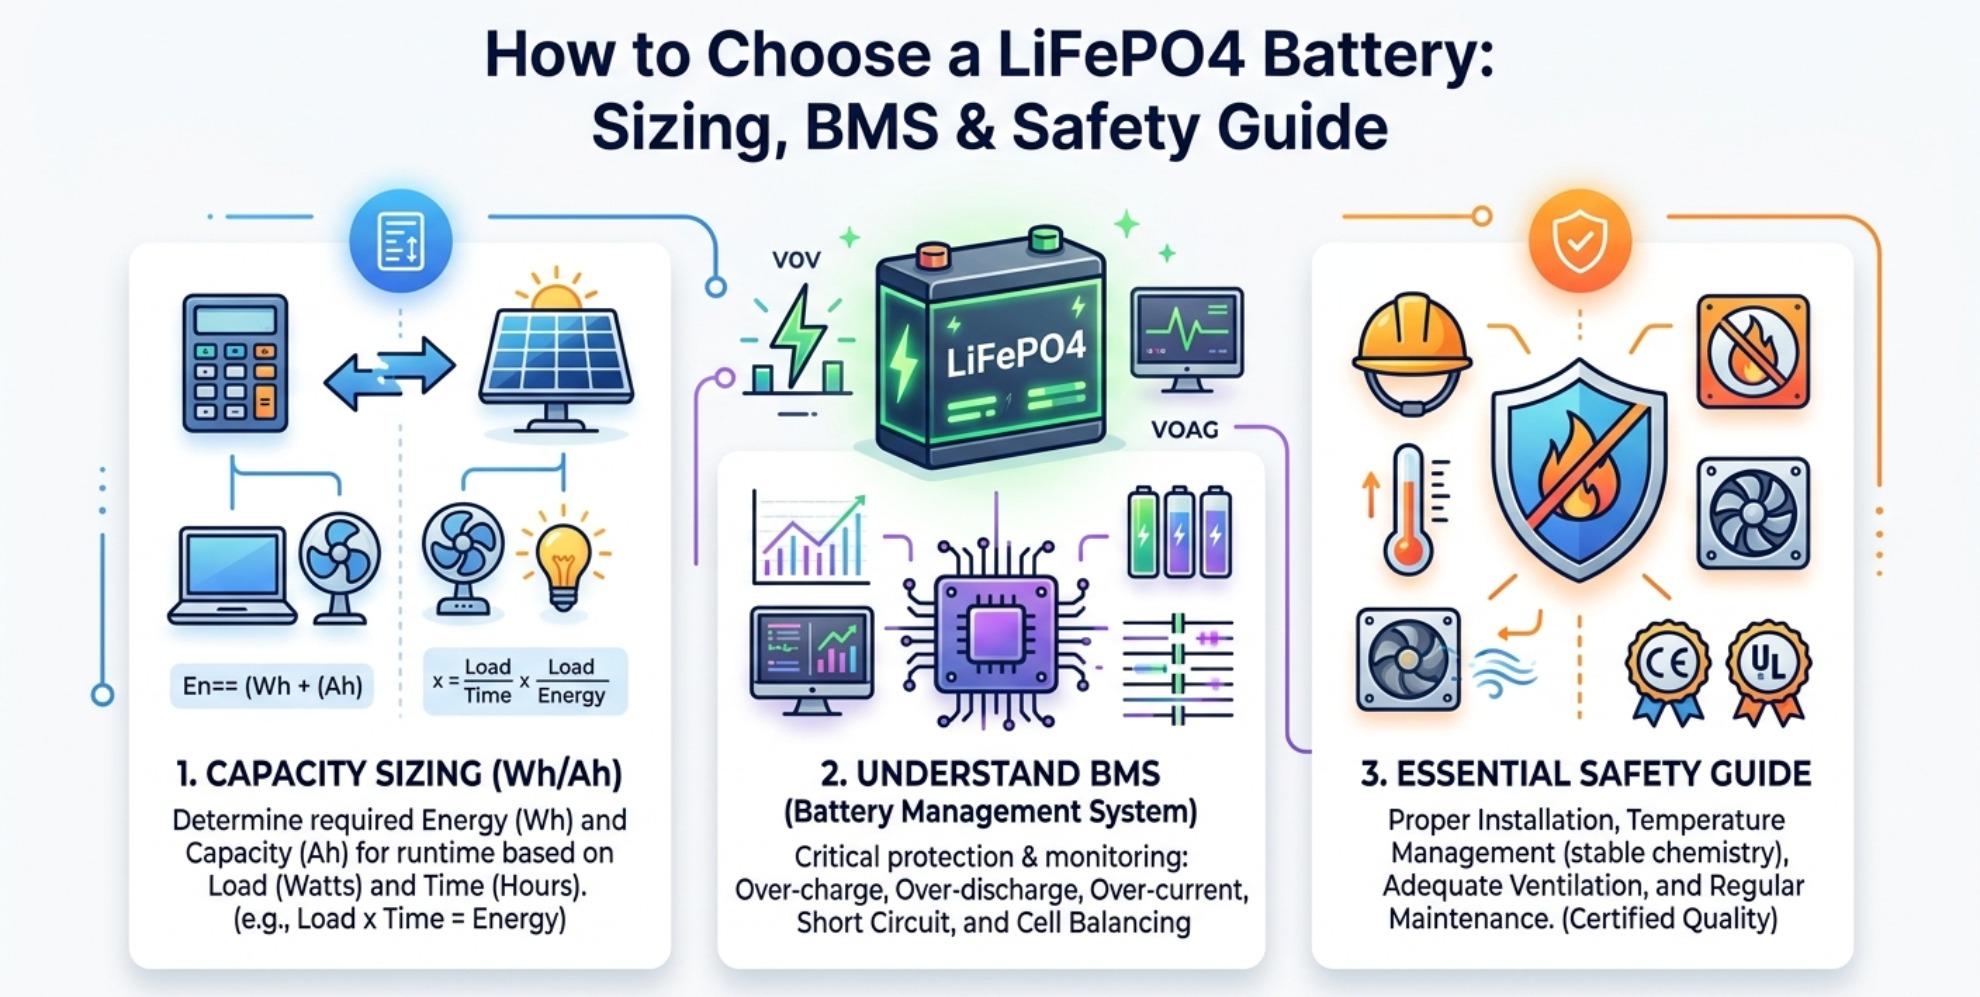
To arrive at the required nominal battery capacity, engineers work through a series of practical adjustments based on real-world operating conditions:
1. Start with the usable energy you actually need for your use case — whether that’s peak shaving, backup power or solar time shifting.
2. Divide that figure by the maximum safe depth of discharge (DoD). For LFP batteries, a maximum DoD of 80–90% is commonly specified by manufacturers to preserve cycle life and uphold warranty coverage, but exact limits vary by cell chemistry and product specifications.
3. Account for inverter efficiency. Modern commercial bi-directional inverters run at 95–98% efficiency, so you’ll need to factor in those AC-DC conversion losses.
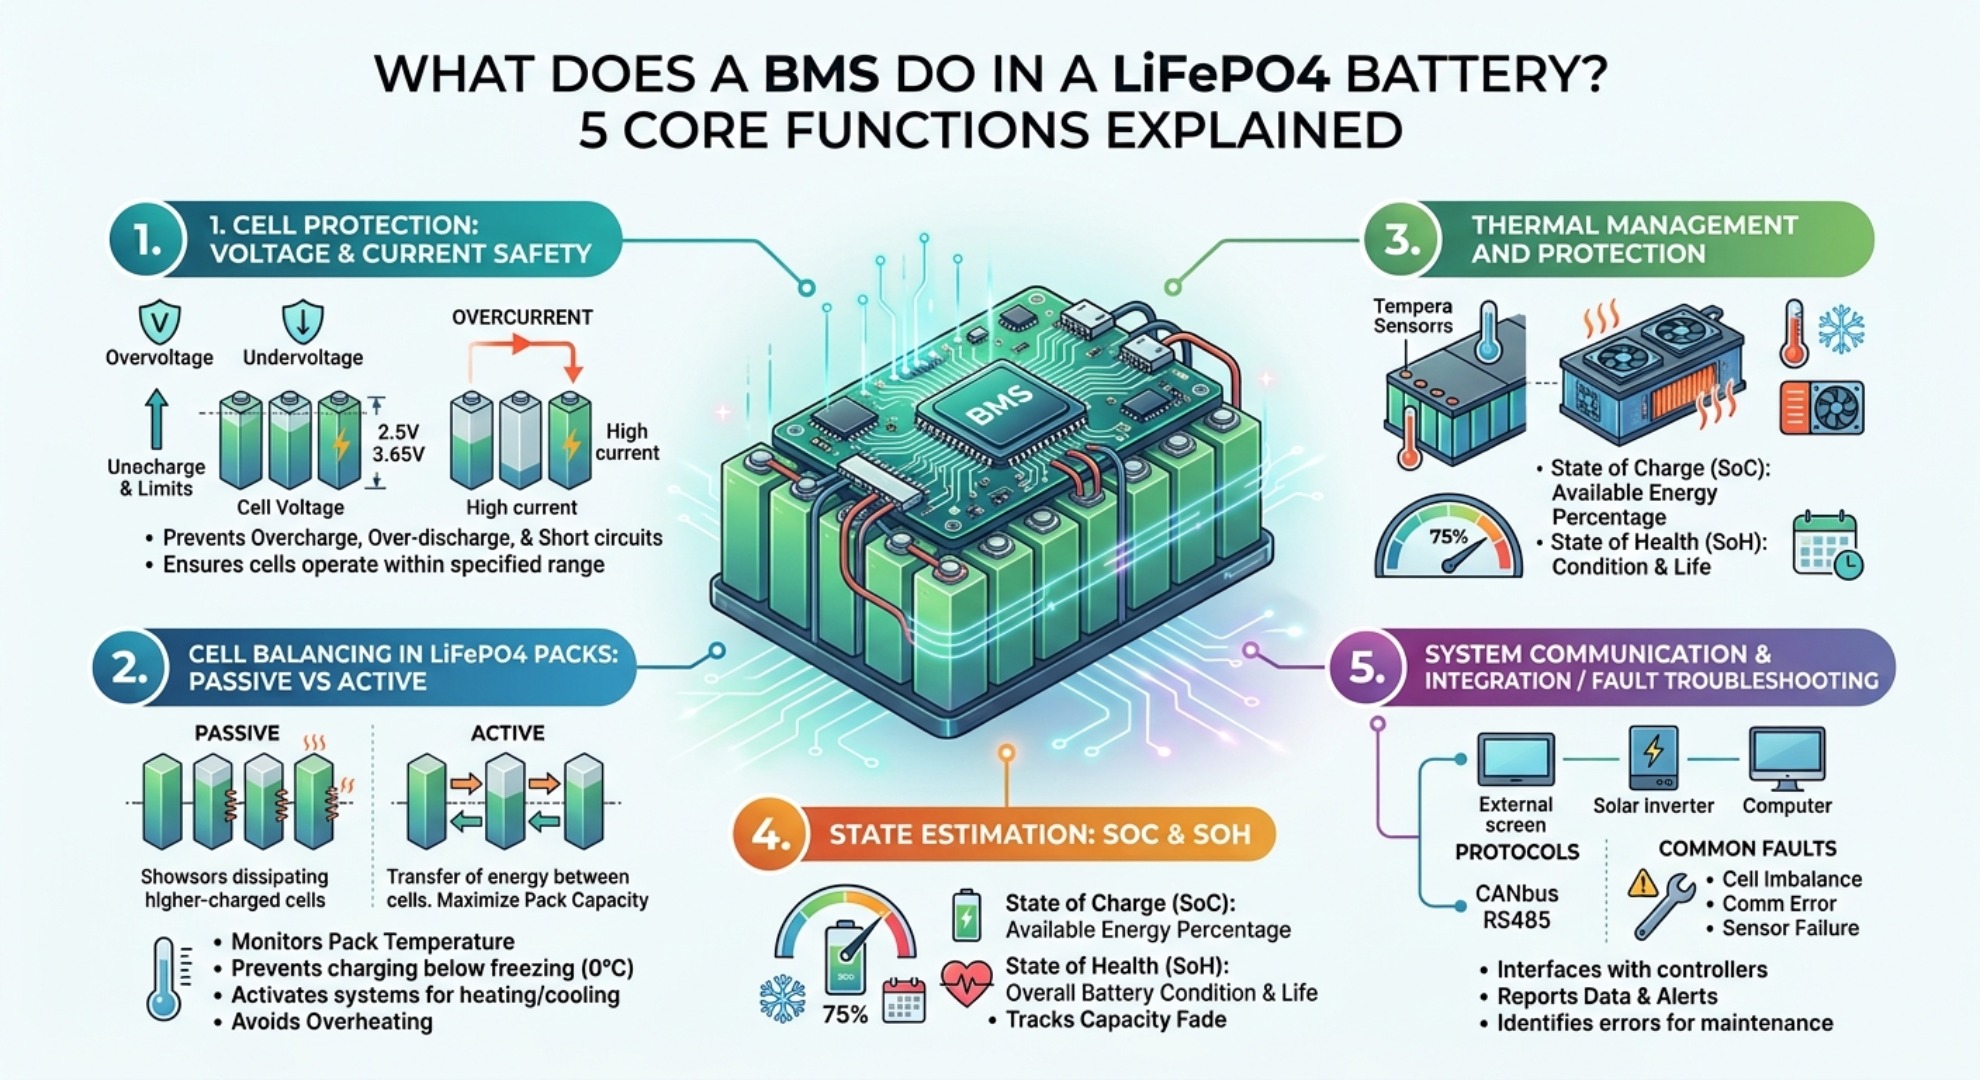
4. Add an allowance for auxiliary loads including the BMS, thermal management systems and monitoring equipment. The share of capacity consumed by these components varies with system size, cooling design and ambient conditions.
5. Apply an end-of-life derate. Many project models assume 80% remaining capacity at the end of a 10–15 year design life, a common baseline aligned with typical manufacturer warranty terms. Actual degradation rates depend on operating temperature, depth of discharge and cycle frequency.
Run through these adjustments, and you’ll land on a nominal battery capacity that delivers the usable energy you need, from day one through to the end of the system’s design life.
Financial ROI & Operational Efficiency Optimization
Long-term financial performance depends on balancing usable capacity against cycle life expectations. System designers factor in C&I BESS round trip efficiency when projecting annual energy savings, as conversion losses between AC and DC power directly impact net energy delivered. A well-engineered behind the meter energy storage sizing solution delivers predictable payback periods while maintaining utility grid compliance and operational reliability.
Building a solid financial model means layering in utility rate structures, available incentives, tax credits and expected energy price inflation to calculate payback timeline and levelized cost of energy. Stacking multiple value streams — demand charge savings, time-of-use arbitrage, demand response payments and higher solar self-consumption — improves overall project economics and shortens the payback timeline. An intelligent energy management system squeezes out even more value, automatically adjusting charge and discharge timing based on live pricing, weather forecasts and predicted facility load. Getting the sizing right also protects cycle life by avoiding unnecessary deep discharges and aggressive charge rates, which cuts long-term maintenance and replacement costs.
Frequently Asked Questions About C&I Battery Sizing
What is the difference between battery power and battery capacity?
Battery power is measured in kW and describes how much power the system can deliver at one time. Battery capacity is measured in kWh and describes how much energy the system can store and deliver over a period of time.
How do you size a commercial battery for peak shaving?
Start with the site load profile and target grid import limit. The battery power should cover the required peak reduction, while its usable energy should cover the duration of the peak event.
How much battery capacity is needed for backup power?
Multiply the critical load in kW by the required backup duration in hours, then adjust for usable DoD, system efficiency, auxiliary consumption, temperature, and end of life capacity.
Does a larger C&I battery always provide better ROI?
No. An oversized battery can increase capital cost without producing proportional savings. The correct size depends on the load profile, tariff structure, operating strategy, project cost and required resilience.
Battery Power kW vs Energy kWh Guide
LFP Battery Winter Performance: Cold Weather Case Study