


Grade A vs Grade B LFP Cells: How to Spot Quality Differences
Grade A vs Grade B LFP Cells: How to Spot Quality Differences

Table of Contents
- LFP Cell Grading Standards
- What is Grade A LFP Cell
- Origins of Grade B Cells
- Physical Inspection Overview
- QR‑Code & Tampering Check
- Casing, Terminal & Swelling Check
- LFP Technical Testing Overview
- Capacity Verification Test
- AC Internal Resistance Test
- Self‑Discharge & Voltage Stability
- Operational Performance Impact
- Cell Consistency & BMS Drift
- Cycle Degradation & Thermal Risks
- Buyer Quality‑Check Checklist
More people are building their own solar off‑grid systems and battery backup banks with LiFePO4 cells. Most new builders quickly run into confusion over Grade‑A and Grade‑B cell labels. Your storage setup will only perform as well as the cells you start with. Even a good BMS cannot fix poorly matched cells. You will end up with less usable runtime, faster wear‑out, and unexpected failures if you cut corners on cell quality. It is also worth considering how your choice interacts with prismatic and cylindrical cell format differences for home‑scale energy storage projects.
LFP Cell Grading Standards
Understanding LiFePO4 Cell Grading: Definition and Manufacturing Standards
Every LFP cell gets screened right off the production line. Factories run electrical, dimensional and visual checks then sort cells into different groups. Keep one critical point in mind: there is no global industry rule that defines Grade‑A or Grade‑B. Each manufacturer sets its own thresholds. Always cross‑check measured results against the official datasheet from the actual cell maker, not marketing text from resellers.
What is Grade A LFP Cell
What Defines a True Grade A LFP Cell?
Top‑tier battery manufacturing adheres strictly to factory specification compliance across every production run. When prismatic LFP cell quality matches 100% of the manufacturer's engineering benchmarks for nominal capacity, physical dimensions, weight tolerance, and electrochemical stability, the unit earns a primary Grade A rating. These premium cells are engineered for demanding applications, featuring ultra‑low internal resistance, uniform chemistry, and official manufacturer backing.
Grade‑A cells come from consistent production batches. Electrode coating thickness, electrolyte fill and internal compression all stay within tight factory limits. These cells go into new electric vehicles, grid‑scale storage and premium home battery systems. Traceability records stay intact, and these cells qualify for original factory warranty coverage.
Origins of Grade B Cells
How Grade B LFP Cells Enter the Market
Conversely, off‑spec battery cells that fall short of rigorous factory standards by even 2% to 5% in capacity or display minor dimensional variance are sorted out during automated quality assurance checks. These downgraded lithium cells are not inherently dysfunctional, but they lack the strict consistency required for high‑drain EV powertrains or utility‑scale grid projects. Consequently, they are redirected toward secondary market energy storage applications, where lower cost takes precedence over precise cell uniformity.
Grade‑B stock comes from many different sources. Some fail end‑of‑line testing by small margins. Some sit too long in warehouse stock. Others get pulled from old EV battery modules. Many grey‑market vendors remove original markings and sell Grade‑B units pretending they are brand‑new Grade‑A. You can use Grade‑B for low‑demand builds, but expect shorter service life and wider cell‑to‑cell variation. Never mix Grade‑A and Grade‑B inside the same battery pack, as this will amplify internal resistance mismatch across your series‑parallel string.
Physical Inspection Overview
Key Physical Indicators: How to Inspect LFP Cells Visuals and QR Codes
Do visual checks as soon as your shipment arrives. Physical clues often point to reconditioned or mis‑represented stock before you assemble anything. If you can, grab reference photos of genuine new cells from the manufacturer website for side‑by‑side comparison.
QR‑Code & Tampering Check

Laser‑Etched QR Code Traceability and Tampering Signals
Visual verification begins by examining the laser‑etched matrix code located on the top cover near the terminal post. Authentic factory production maintains complete battery cell traceability through a crisp, deeply engraved original manufacturer QR code that encodes the manufacturing date, factory site, cell chemistry, and raw material batch number.
Many secondary‑market sellers grind or scratch away these codes to hide real production dates and cell origins. A sanded‑off QR or brand‑new PVC insulation sleeve often means old or downgraded cells are being passed off as new. Sticker labels placed over laser engraving are another common red flag. Scan the QR whenever you can and confirm batch data matches what your supplier told you.
Casing, Terminal & Swelling Check
Physical Casing Defects, Terminal Oxidation, and Cell Swelling
Carefully inspect the aluminum casing for subtle mechanical imperfections, surface denting, or structural abnormalities. Presence of terminal oxidation marks or visible battery cell pouch swelling indicates prior exposure to excessive ambient heat, moisture, or improper storage conditions. Premium units feature perfectly flat, unblemished aluminum walls, clean laser‑welded terminals, and strict dimensional tolerances within ±0.1 mm.
Even small dents can damage internal electrode layers and create hidden micro‑short risk. Look for grinding marks on terminal surfaces; sellers polish these to hide burn marks from past high‑current use. Any swollen cell must not go into your pack. Isolate it and arrange safe lithium‑ion recycling per your local waste rules.
LFP Technical Testing Overview

Technical Testing Methods: Measuring Capacity, Resistance, and Self‑Discharge
Visual checks only take you so far. Real electrical testing is the most reliable way to tell genuine Grade‑A apart from Grade‑B or refurbished stock. Keep test conditions consistent: stable room temperature, same charge‑discharge rates, and proper rest time between cycles. Skipping testing often leads to expensive failures after finishing assembly.
Capacity Verification Test
Precision Capacity Testing and Nominal Ah Verification
Accurate performance validation requires connecting individual units to a calibrated battery capacity tester inside a temperature‑controlled environment (25°C ± 2°C). Executing a complete 0.5C or 1C discharge rate cycle down to the manufacturer's cut‑off voltage allows direct amp‑hour rating verification against published technical specifications. High‑grade cells typically meet or slightly exceed their rated Ah capacity on initial cycling.
Most industry technicians prefer 0.5C discharge tests for real‑world usable capacity. Faster 1C tests read slightly lower for all LFP chemistries. When building multi‑cell packs, group cells with closely‑matched measured capacity values. Larger gaps between individual cells make imbalance worse during charge and discharge cycles.
| Parameter | Grade A Specification | Grade B Typical Range | Testing Condition |
|---|---|---|---|
| Capacity vs. Datasheet | 100% to 105% of rated Ah | 92% to 98% of rated Ah | 0.5C discharge rate at 25°C |
| AC Internal Resistance | Meets strict datasheet maximum | 10% to 30% higher than spec | 1kHz AC milliohm meter |
| Self‑Discharge Rate | < 3% capacity loss per month | > 5% capacity loss per month | Stored at 50% SOC for 14 days |
| Cycle Life Expectancy | 4,000 to 6,000+ cycles (to 80% SOH) | 1,000 to 2,500 cycles | 80% Depth of Discharge (DoD) |
| Factory Warranty | 3 to 5+ years with full traceability | 1 year or no factory warranty | Manufacturer dependent |
AC Internal Resistance Test
Internal Resistance Measurement via AC Impedance Testing
Evaluating internal impedance requires a specialized AC internal resistance meter functioning at a standard 1kHz testing frequency. Performing a 1kHz impedance measurement yields immediate data regarding internal ohmic resistance, where elevated milliohm readings reveal poor electrode foil coating, uneven electrolyte distribution, or internal chemical degradation.
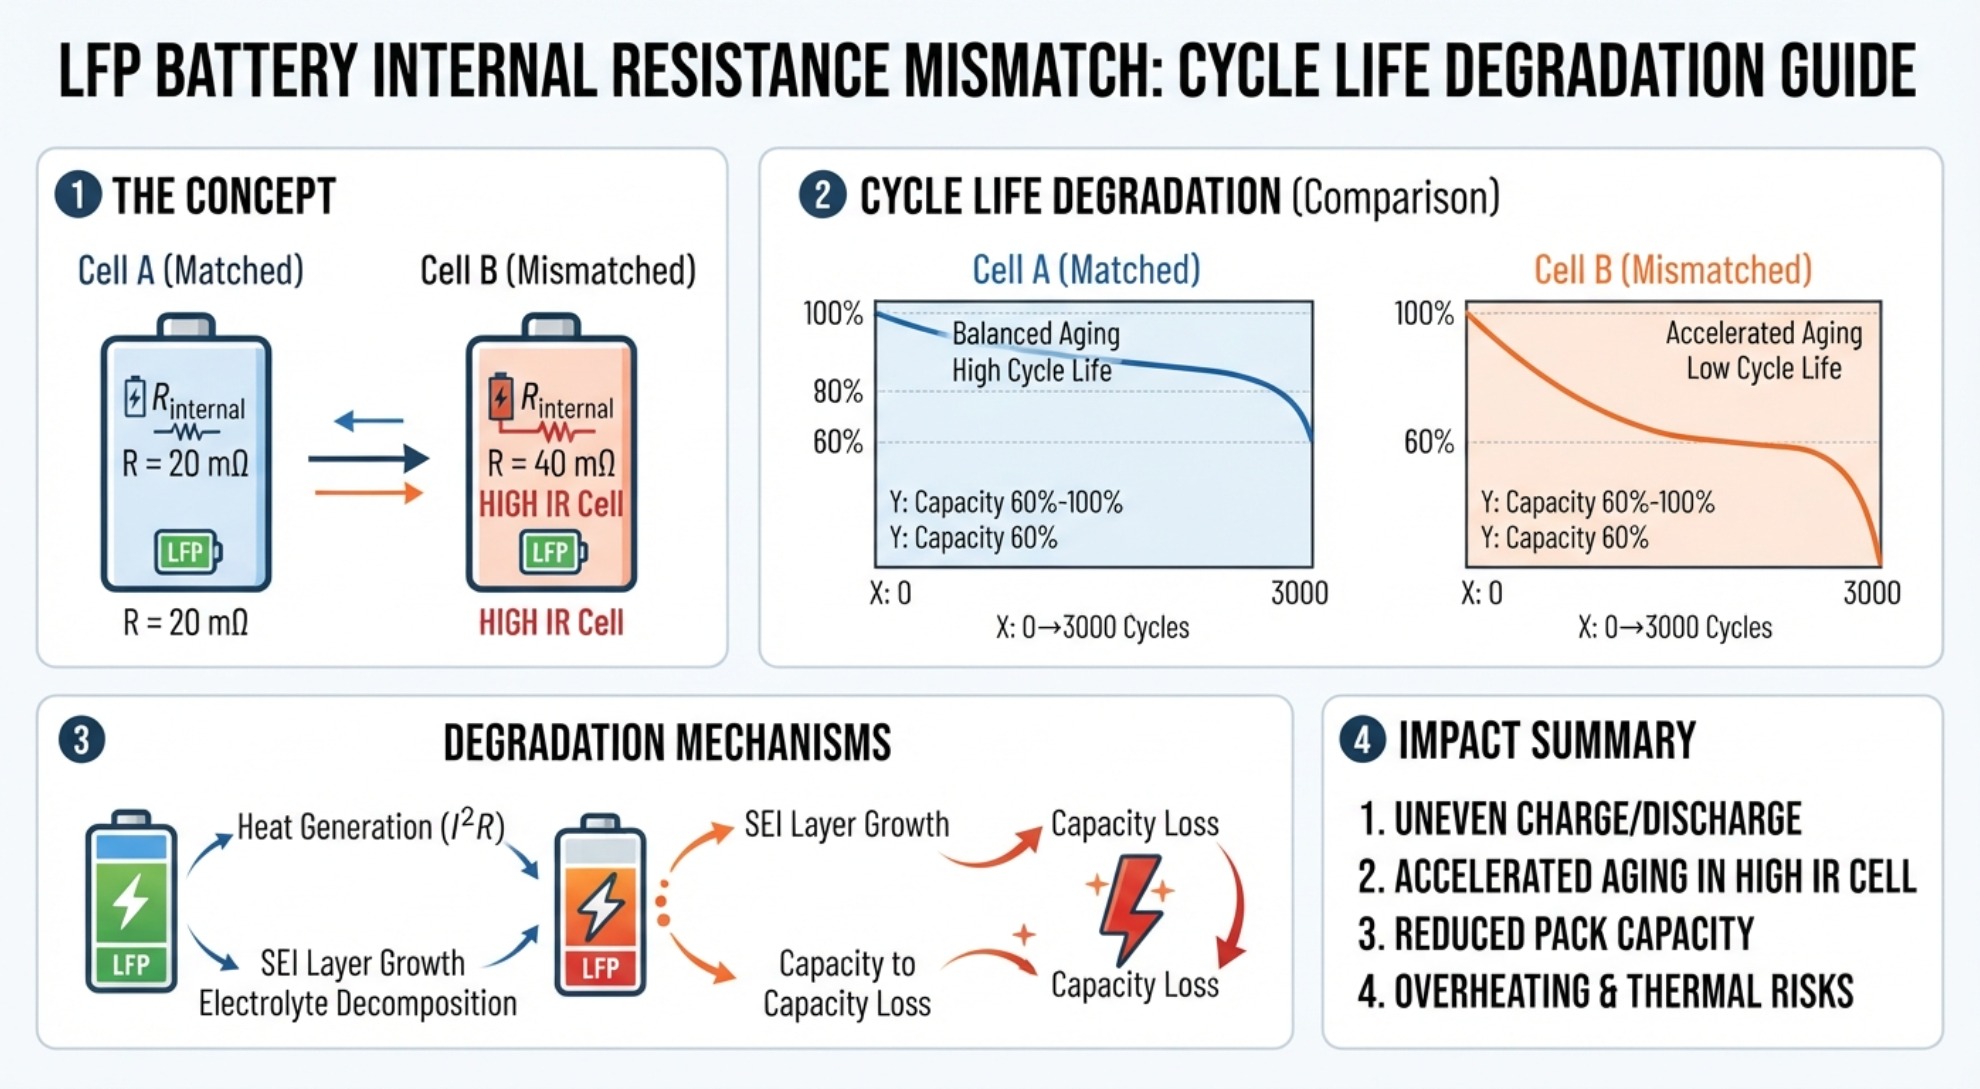
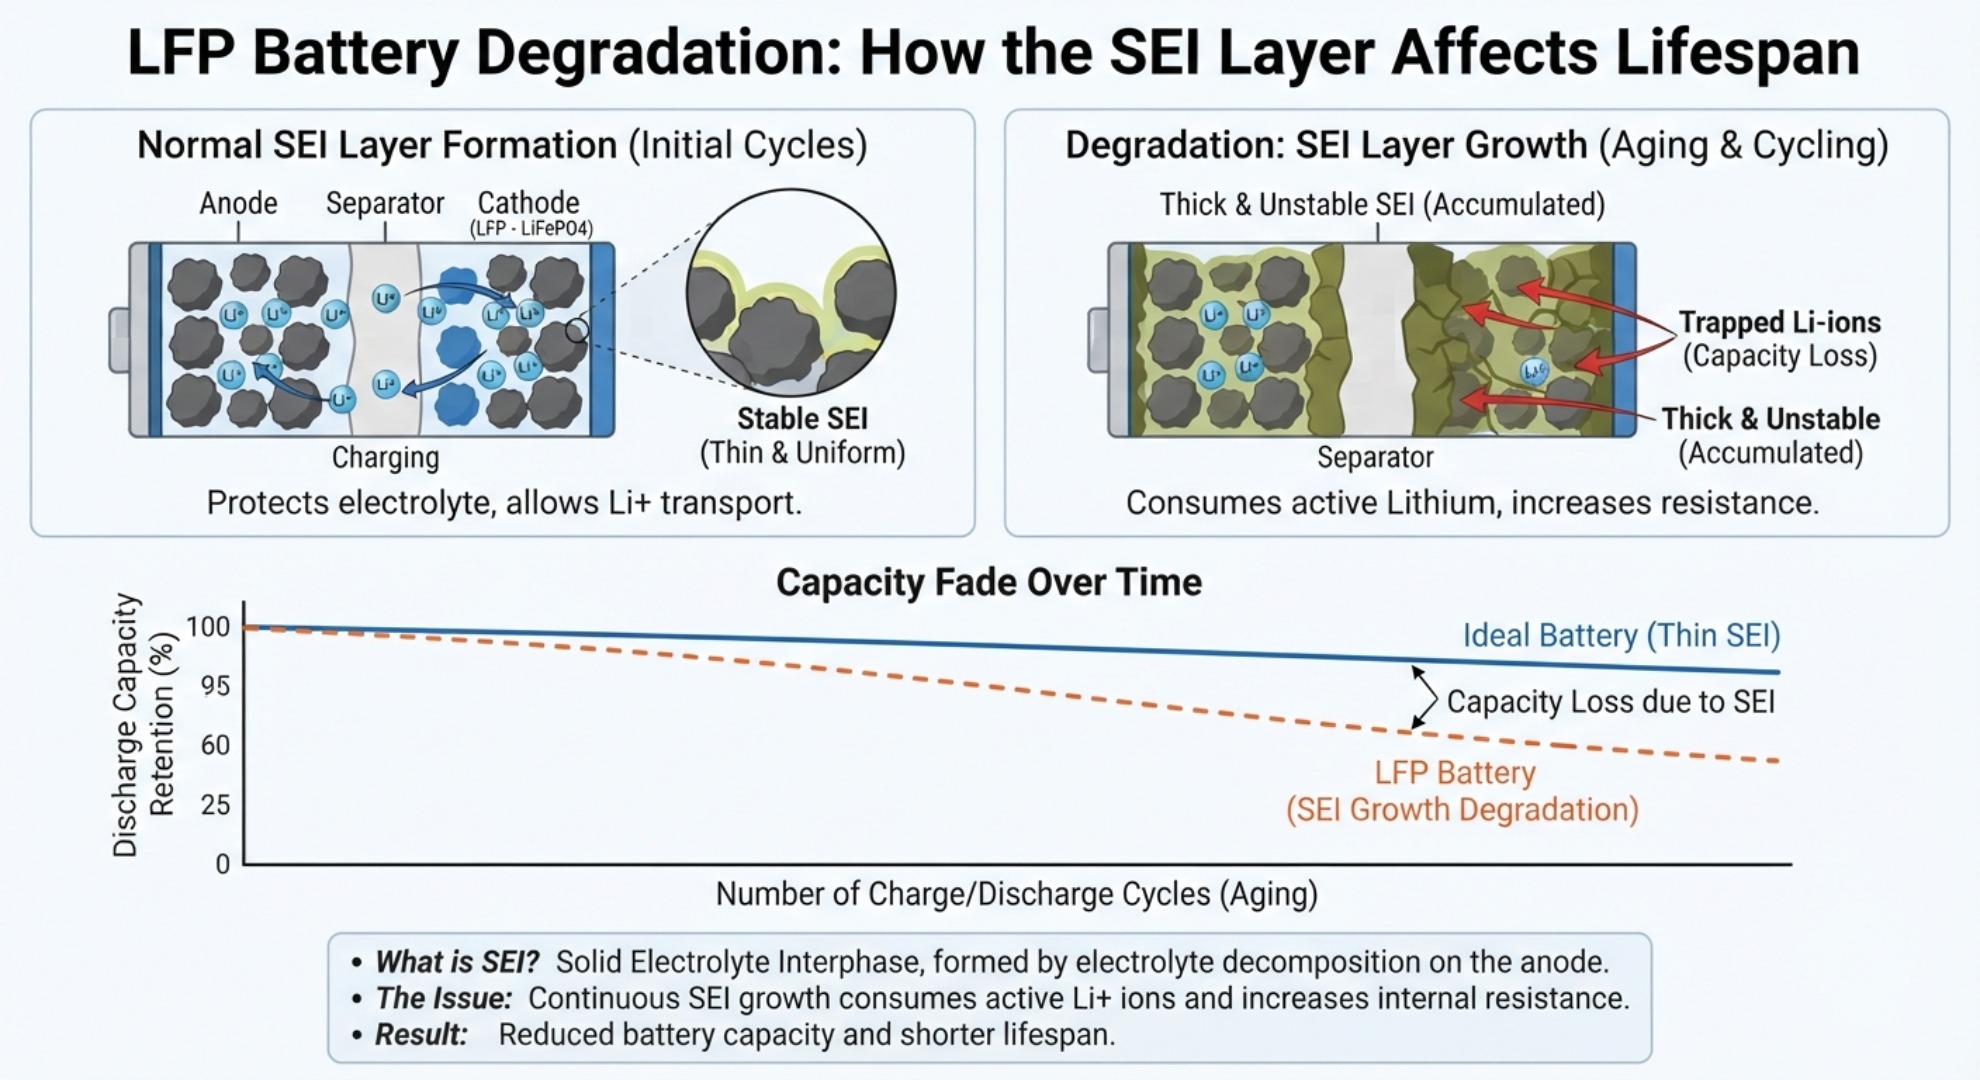
Higher internal resistance generates extra heat under load. This matters for off‑grid inverters and high‑current motor setups. For series‑parallel packs, aim for tight internal‑resistance matching for every single cell. Small resistance differences grow larger as pack temperature rises during operation, and this ongoing drift is partially driven by SEI layer growth inside LFP cells.
Self‑Discharge & Voltage Stability
Evaluating Voltage Retention and Self‑Discharge Rates
Determining long‑term chemical stability involves measuring the battery self‑discharge rate over a 14‑day resting period. Premium cells maintain consistent open circuit voltage retention when sitting at 50% state of charge, whereas inferior units suffer noticeable voltage drift caused by micro‑short circuits across separator layers or impure active materials.
High self‑discharge creates real headaches for packs sitting idle on standby. Cells that self‑discharge fast drift apart on open‑circuit voltage even when your system is turned off. Over weeks of sitting unused, this drift forces your BMS into heavy balancing work, wasting energy and speeding up overall pack wear.
Operational Performance Impact
Operational Impact: Cell Balancing, BMS Dynamics, and Long‑Term Lifespan
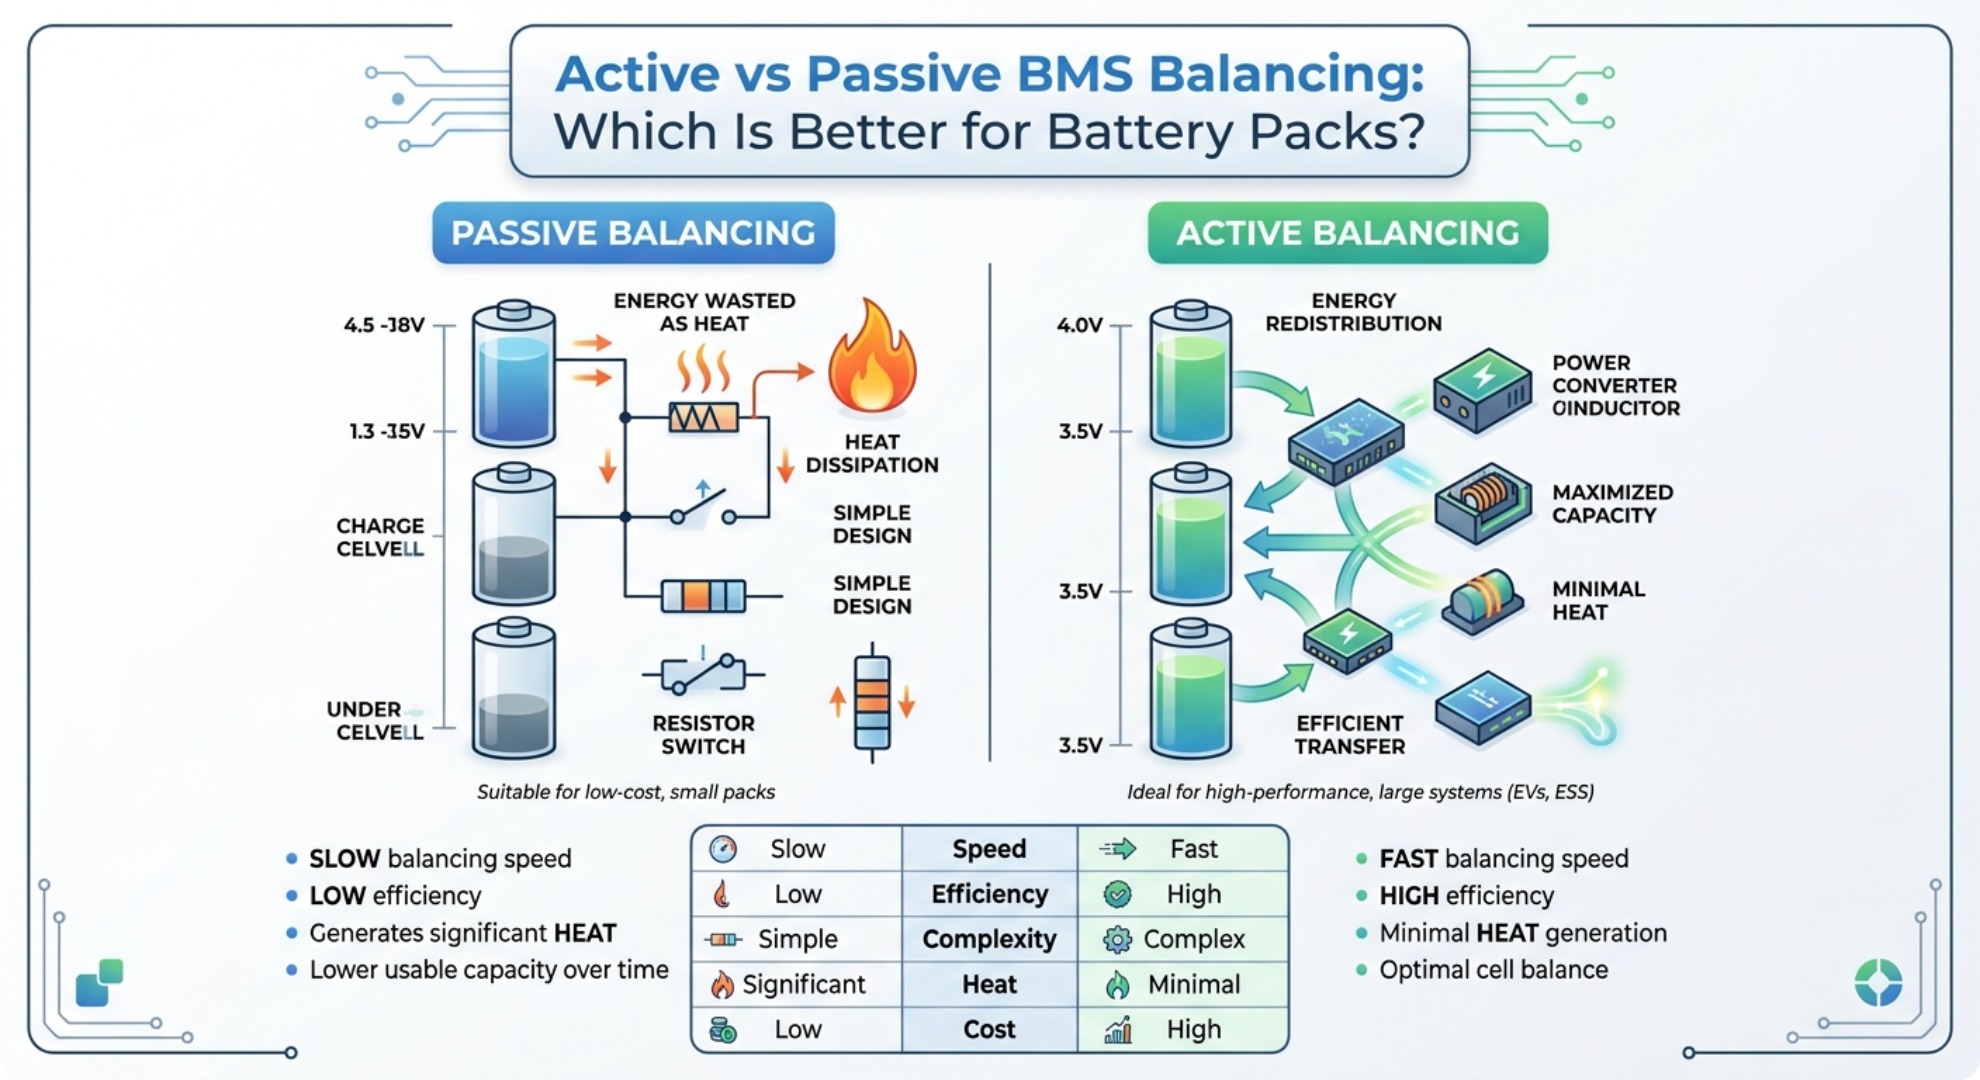
Many pack builders fall for a common misconception: they think a good BMS will fully fix low‑grade or mismatched cells. BMS hardware delivers critical safety protection plus passive or active balancing, but it can only compensate for limited mismatch. Large inconsistencies built into Grade‑B cells cannot be completely fixed by BMS settings alone.
Cell Consistency & BMS Drift
Cell Consistency and BMS Voltage Drift
Mixing cells with varying internal resistances inside a series‑connected battery pack complicates battery management system balancing. Significant cell voltage divergence forces the BMS to trigger over‑voltage or under‑voltage protection prematurely, reducing the overall usable pack capacity and creating severe series battery pack mismatch during charge and discharge cycles.
One weak cell limits an entire series string. It hits over‑voltage first on charge and under‑voltage cutoff before other cells fully drain on discharge. Your big‑capacity battery bank ends up delivering far less real‑world energy than its theoretical Ah rating. Active balancing helps, but it cannot get around this fundamental hardware limitation.
Cycle Degradation & Thermal Risks
Cycle Life Degradation Curves and Thermal Safety Risks
Over years of daily power cycling, lower‑tier cells follow a steep cycle life degradation curve compared to balanced, primary‑grade cells. Operating under continuous 80% depth of discharge accelerates capacity fade, increases internal heat generation during fast charging, and elevates thermal runaway risk under high‑load operating conditions.
LFP chemistry is safer than NMC lithium‑ion, but poorly graded or worn‑out cells still carry hazards. Extra heat from mismatched packs can damage separators, trigger venting and shorten life for nearby good‑quality cells. Think through the trade‑offs: short‑term savings buying Grade‑B may mean earlier replacement work and safety concerns for home storage installations.
Buyer Quality‑Check Checklist
Buyer Verification Checklist for LFP Cell Sourcing
- Request an official factory batch test report displaying individual cell serial numbers, matched capacity values, and internal resistance readings.
- Verify that the laser‑etched QR code on top of the cell is intact, legible, and unmarred by grinding or etching tools.
- Measure open‑circuit voltage and 1kHz AC impedance upon delivery to confirm matching voltage and resistance across every cell in your order.
- Inspect terminal welds, safety valves, and exterior insulation sleeves for signs of re‑wrapping, terminal polishing, or mechanical stress.
- Ensure the supplier offers a binding deep cycle battery warranty backed by transparent testing protocols and clear RMA terms under international standards like UL 1973 battery safety guidelines.
One practical tip: keep records of your cell testing work. Save photos of QR codes, casing condition and logged capacity or resistance numbers. This documentation supports warranty claims if cells degrade faster than expected and helps you filter unreliable suppliers for future projects.
Active vs Passive BMS Balancing: Which Is Better for Battery Packs?
LFP Battery Internal Resistance Mismatch Cycle Life Guide