


Peak Shaving Battery Storage ROI
Peak Shaving Battery Storage ROI: Full Commercial BESS Payback Guide
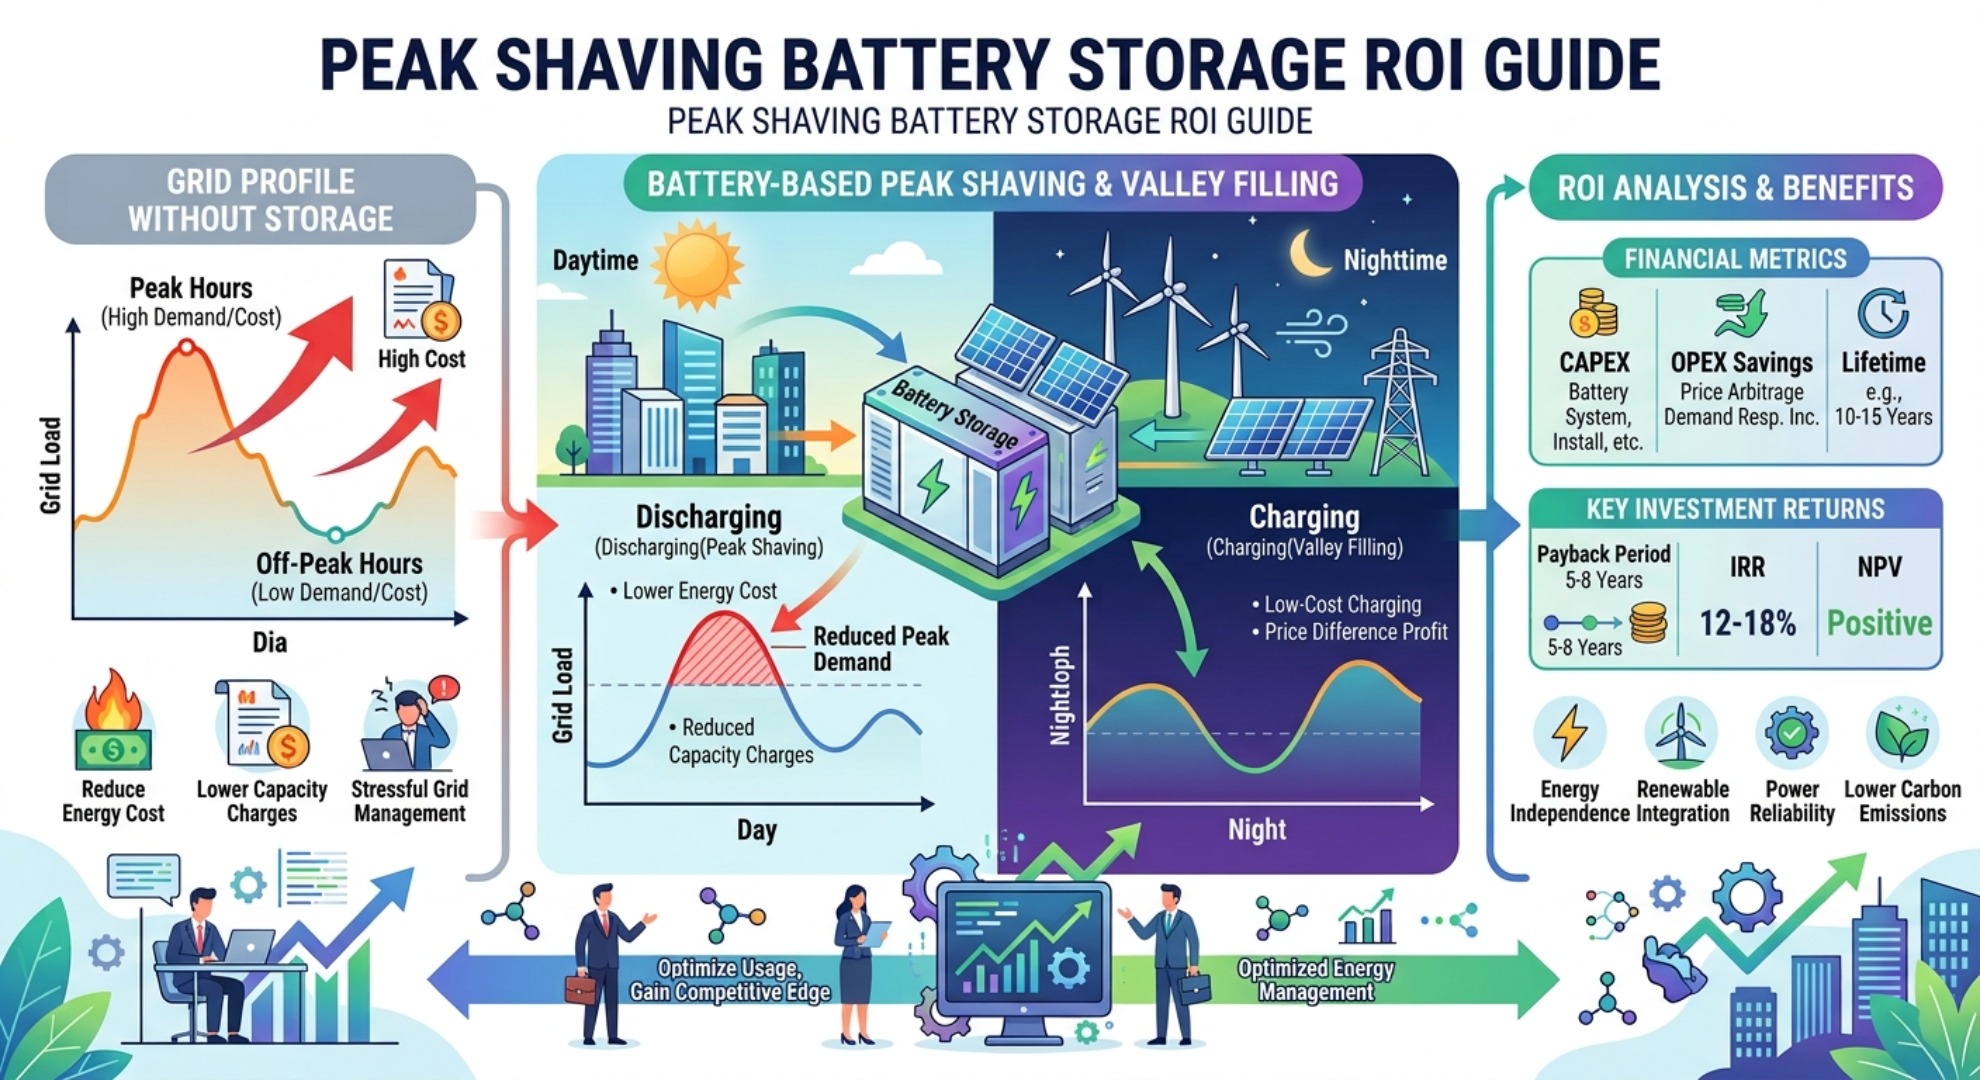
Table of Contents
- Peak Shaving: Core Strategy for Commercial Energy Cost Reduction
- Key Financial Drivers of Demand Charge Reduction
- How to Calculate Commercial BESS ROI and Simple Payback Period
- Revenue Stacking: Maximize BESS Returns With Multi-Use Value
- Technical Factors Impacting Commercial BESS Payback
- Battery Degradation & Life Cycle Economics Management
Peak Shaving: Core Strategy for Commercial Energy Cost Reduction
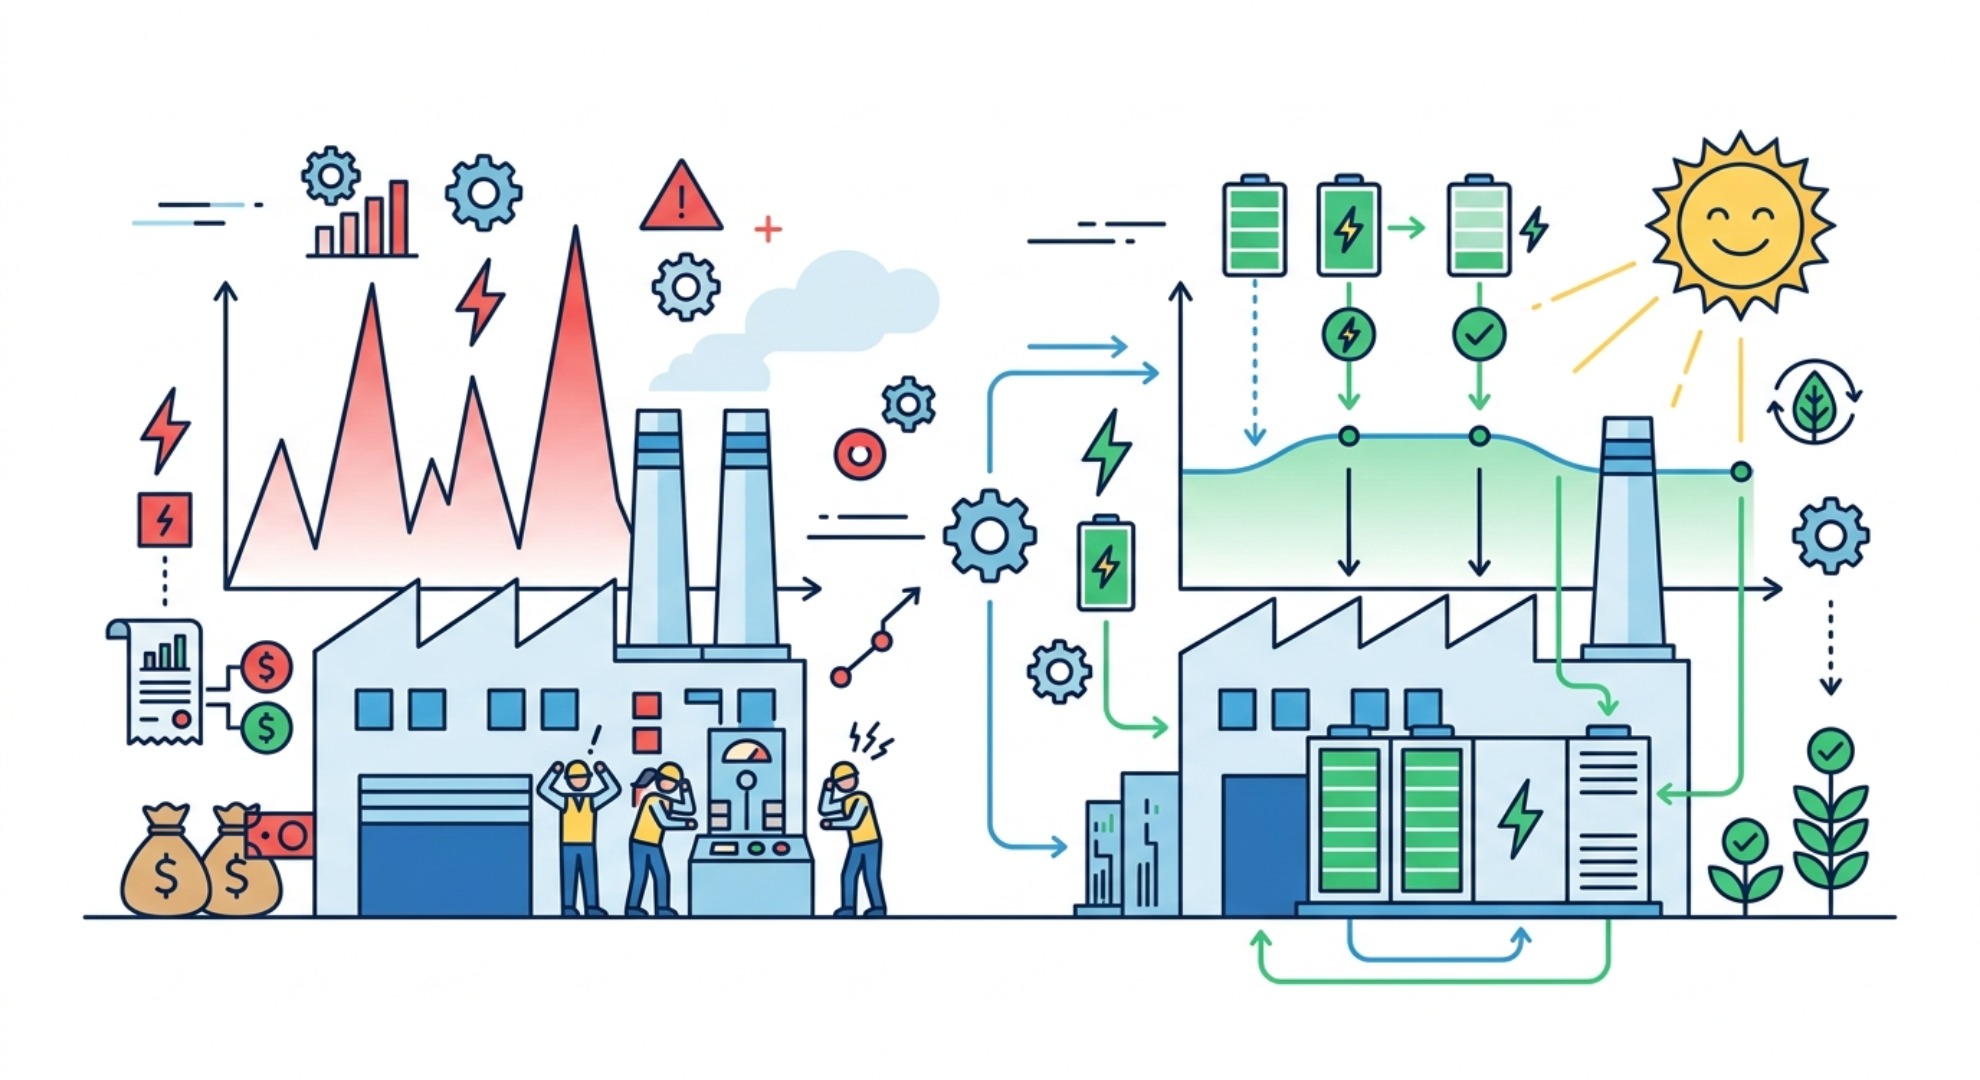
A commercial battery storage ROI model centers on mitigating expensive peak demand charges levied by electric utilities — a line item many facility managers overlook until it makes up half their monthly bill. For manufacturing plants, cold storage warehouses, mid-sized office towers and big-box retail spaces, it is not unusual for short-duration peak power draws to account for 30% to 70% of total monthly energy expenses. These spikes rarely last more than 15 to 30 minutes: think of a production floor starting all conveyor motors at once, or mid-afternoon AC units running full tilt on a 95°F summer day.
By deploying a targeted peak shaving strategy, an automated battery energy storage system (BESS) discharges during these narrow peak windows to cap maximum power draw from the grid. It does not reduce overall energy consumption, but it flattens the building's load profile where it matters most for billing. The result is direct, measurable relief on operational spending and a shorter simple payback period for the system.
Key Financial Drivers of Demand Charge Reduction
Conducting a thorough utility tariff analysis is the first step to identifying exact cost-saving opportunities across monthly billing statements. Rules vary widely by utility territory: most calculate demand fees based on a facility's highest 15-minute average power draw recorded within a billing cycle, while others use 30-minute intervals or even apply a seasonal "peak lock" where one summer high sets the rate for months afterward.
When a battery discharges during these brief usage spikes, it caps the recorded power threshold and lowers the baseline demand fee applied to the entire month. Savings scale directly with local demand rates, which is why projects in territories above $15/kW deliver far faster returns. Factoring in anticipated electricity rate escalation — which averages 3% to 5% annually in major industrial markets, driven by grid upgrades and fuel volatility — further increases the compounding return on investment over a 10-to-15-year operational lifetime.
How to Calculate Commercial BESS ROI and Simple Payback Period
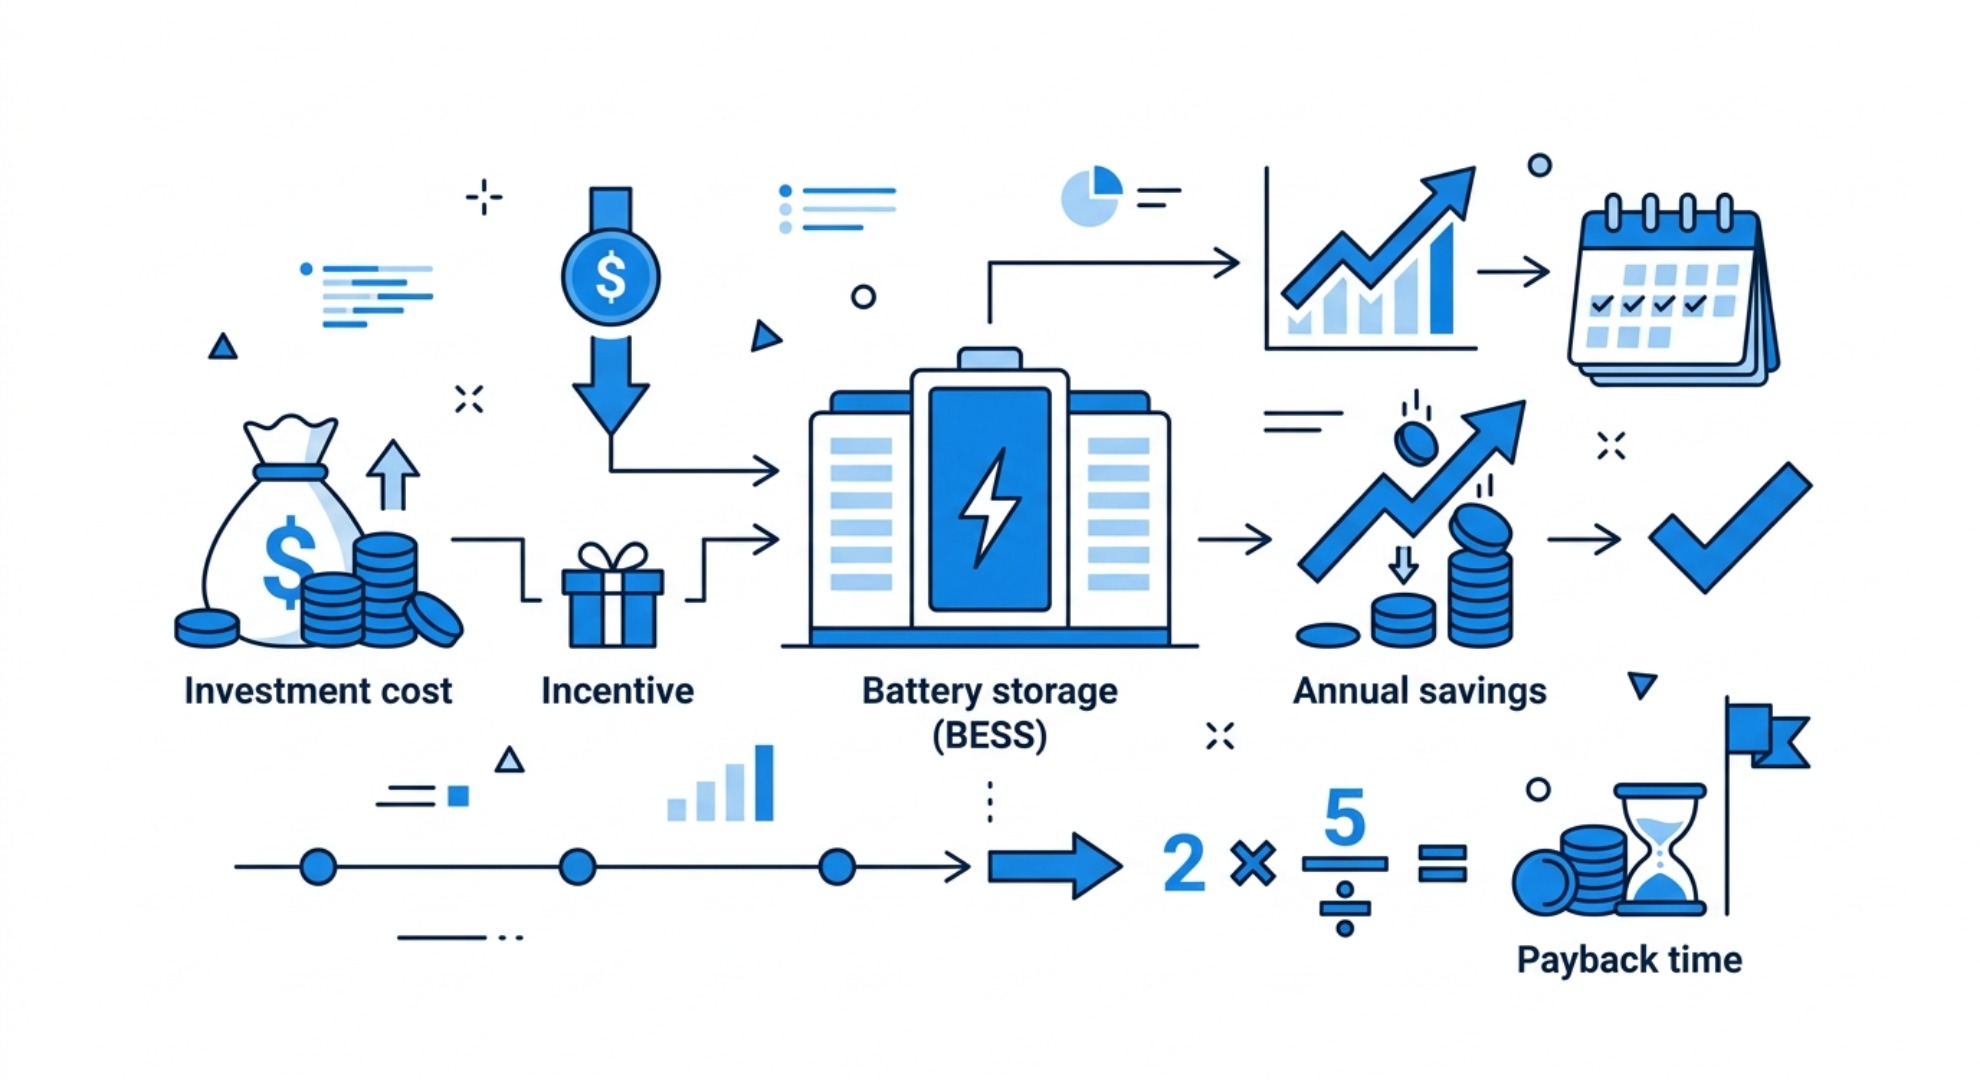
Determining an accurate battery energy storage system payback period requires balancing upfront capital expenditure (CAPEX) against net ongoing cash flows. Simple payback remains the most widely used metric for quick project screening, though full financial models typically add discounted cash flow, inflation and residual value for deeper analysis. The core formula is straightforward:
For a standard 500 kWh / 250 kW commercial system, installed costs generally range between $175,000 and $250,000. Smaller systems under 200 kWh carry slightly higher per-kWh pricing due to reduced economies of scale, while megawatt-scale industrial installations can push unit costs lower. In utility territories with demand charge rates exceeding $15/kW, most commercial and industrial projects achieve financial breakeven in 3 to 6 years before incentives are factored in.
| Metric | Industry Benchmark |
|---|---|
| Demand Charge Rate Target | > $15/kW per month |
| Installed System Cost | $350 – $500 / kWh |
| Target Payback Window | 3.0 – 5.5 Years |
| 10-Year Net Return | 150% – 250% of Initial Equity |
Revenue Stacking: Maximize BESS Returns With Multi-Use Value
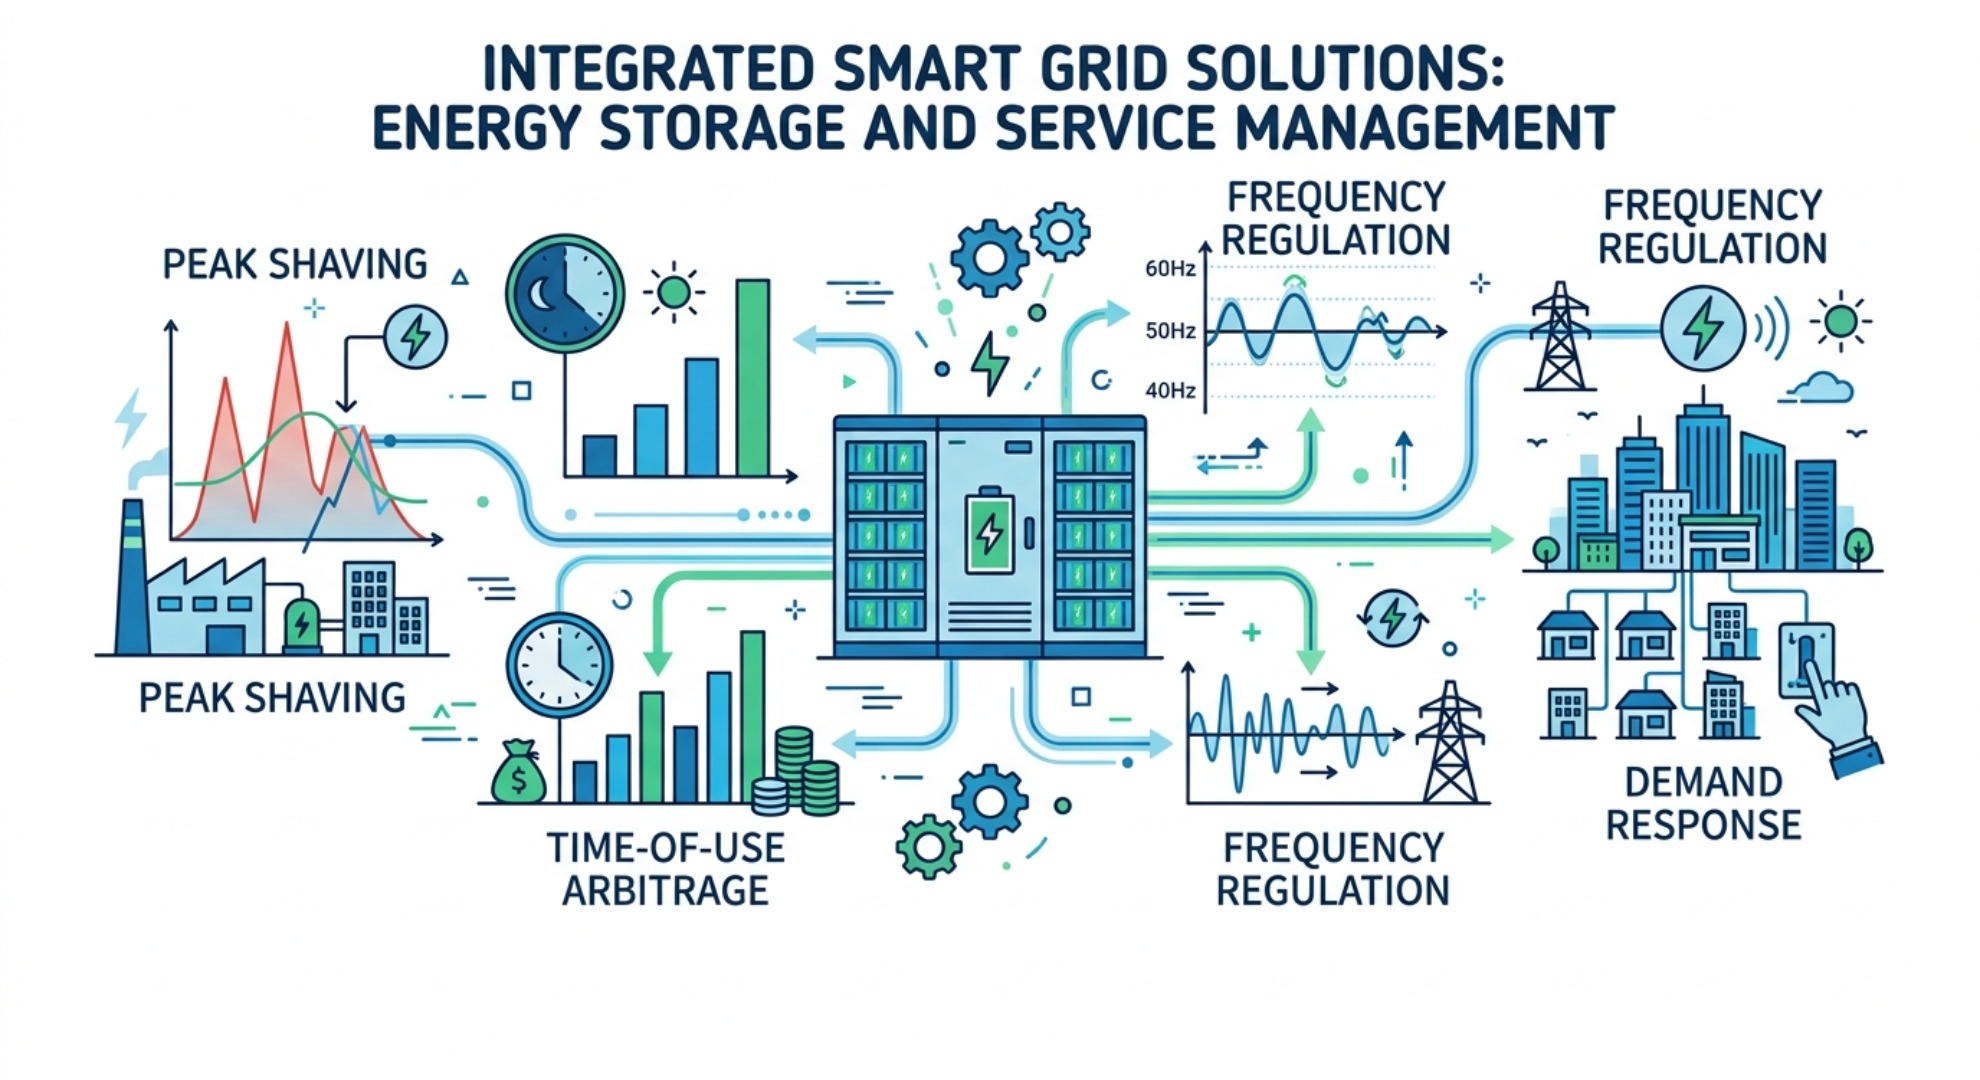
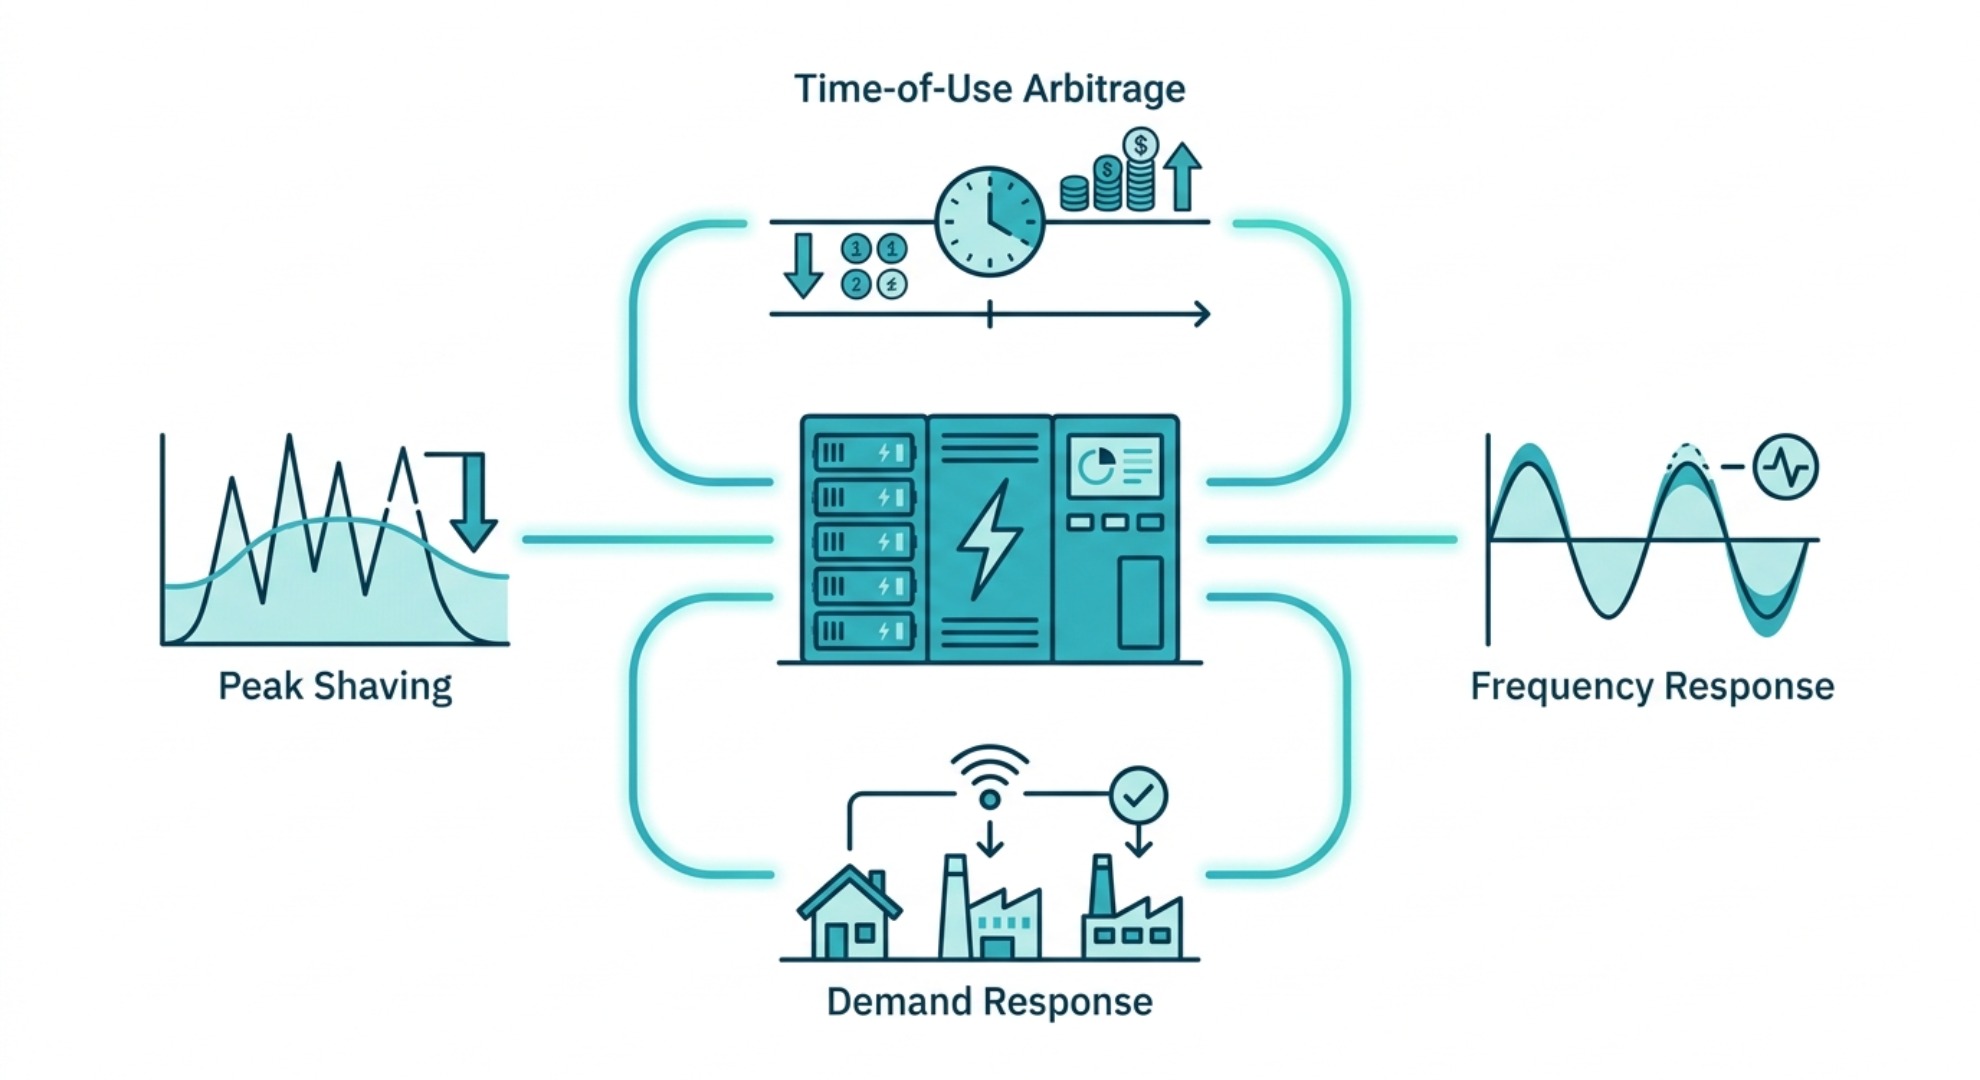
While peak demand reduction provides the core financial return, integrating time-of-use price arbitrage significantly improves total project economics — especially in markets with wide on-peak/off-peak spreads. Under a time-of-use structure, the battery charges from the grid during overnight or midday off-peak hours when rates are lowest and discharges during high-cost evening peak hours. On its own, arbitrage can add 15% to 25% to annual savings in mature TOU markets like California and New York.
Implementing a broader revenue stacking framework also allows the storage asset to participate in regional ancillary grid services — such as frequency response, capacity markets or demand response programs. Not every utility territory offers these programs, but where they exist, they turn a behind-the-meter cost-cutting tool into a grid asset that earns revenue year-round. Across real-world portfolios, stacking two to three value streams typically increases annual net revenues by 20% to 40% compared to peak shaving alone.
Technical Factors Impacting Commercial BESS Payback
Achieving targeted financial returns depends on an accurate BESS sizing calculation, and getting this wrong is one of the most common reasons projects underperform. Over-sizing the storage system inflates upfront capital costs without generating proportional demand savings, leaving excess capacity sitting idle most months. Under-sizing leaves uncaptured peak load on the grid during extreme weather or unexpected production surges, so the highest demand interval never gets fully shaved.
Sizing models must also balance usable capacity against round-trip efficiency losses, which typically account for 10% to 15% energy loss across a full charge-and-discharge cycle when measured at the AC side. Quoted DC-side efficiency numbers often look better on paper, but real-world savings follow what actually comes out of the inverter into the building. Temperature, charge/discharge rate and battery chemistry all shift this number over time.
Battery Degradation & Life Cycle Economics Management
Financial modeling should incorporate national and regional incentives — such as the federal investment tax credit for storage or state-level clean energy rebates — to lower the initial capital baseline. In many U.S. markets, combined federal and local incentives can reduce net CAPEX by 30% to 40%, which alone can cut payback time by a year or more.
Long-term projections must also account for an average annual battery degradation rate of 0.5% to 1.5% for LFP chemistries under normal operating conditions. Aggressive cycling, deep discharges and high ambient temperatures will accelerate fade. By utilizing intelligent energy management systems that optimize charge cycles around actual facility peaks — rather than cycling the battery fully every day — operators ensure long-term battery life cycle optimization, maintaining over 80% capacity retention through year 10 while protecting overall yield. End-of-life residual value from second-life battery reuse can further improve the 15-year total return.
For further regulatory details and energy market data, consult official resources on commercial electricity utility tariffs and clean energy tax credits and incentives.
Microgrid and Offgrid Battery System Design
Battery Power kW vs Energy kWh Guide